

Table of contents
- Intro
- Step 1: Create a Free Azure Account
- Step 2: Create the Honeypot Virtual Machine
- Step 3: Create a Log Analytics Workspace (LAW)
- Step 4: Configure Microsoft Defender for Cloud
- Step 5: Connect Log Analytics Workspace to the VM
- Step 6: Setup Azure Sentinel
- Step 7: Disabling the VM Firewall
- Step 8: Setting up PowerShell Script
- Step 9: Create Custom Log in Log Analytics Workspace
- Step 10: Query the Custom Log
- Step 11: Create a Workbook in Sentinel
- Step 12: Deprovision Resources
- Afterthoughts
- Additions

Intro
In this article, I will be going over how to setup an intentionally vulnerable virtual machine within Azure. We will then ingest the logs from this VM into a Log Analytics Workspace (LAW), transform the data, and export it to Sentinel for visualization on a map which will show us from where in the world the VM is being probed/attacked. The goal of this lab is to become familiar with enterprise-level techniques for collecting and analyzing data to better help an organization understand potential threats to their operations.
Before we begin, a brief explanation of the components of this lab:
Honeypot (Virtual Machine): A honeypot is a deliberately vulnerable part of a network. It could range from a single VM like in our case, to exposed fake data, to an entire subnet of devices. Their purposes include early detection of interest from attackers, wasting attackers' time with phony data or systems, and study of attackers' methods.
SIEM (Sentinel): At a basic level, a SIEM is like a digital security guard for a computer network. It collects and analyzes data from different devices and applications to detect and respond to potential cyber threats. They provide a centralized view and real-time analytics of log data from hardware and software sources which enables efficient threat detection, response, and remediation.
Log Analytics Workspace: An Azure Log Analytics Workspace is a centralized repository that aggregates and stores log data and telemetry from various sources. It allows comprehensive analysis and monitoring of an organization's applications and infrastructure. You can also use Microsoft's proprietary Kusto Query Language (KQL) language to query collected data which can assist with troubleshooting and trend analysis.
Step 1: Create a Free Azure Account
- Visit https://azure.microsoft.com/en-us/free and go through the process of setting up a new account.
Step 2: Create the Honeypot Virtual Machine
Here we will create the virtual machine running Windows 10 which will serve as our honeypot. Our goal is for this virtual machine to simulate a poorly secured workstation to entice attackers to take notice of it.
From portal.azure.com search for "Virtual Machines" in the top search bar.
Click Create > Azure Virtual Machine
Create new resource group and name it (sentinel-lab)
Adjust your settings to match the following:
Name your VM (honeypot-vm01)
Select a region (West US 3)
Image: Windows 10 Pro
Create a username and password for virtual machine
Public inbound ports: Allow RDP (3389)
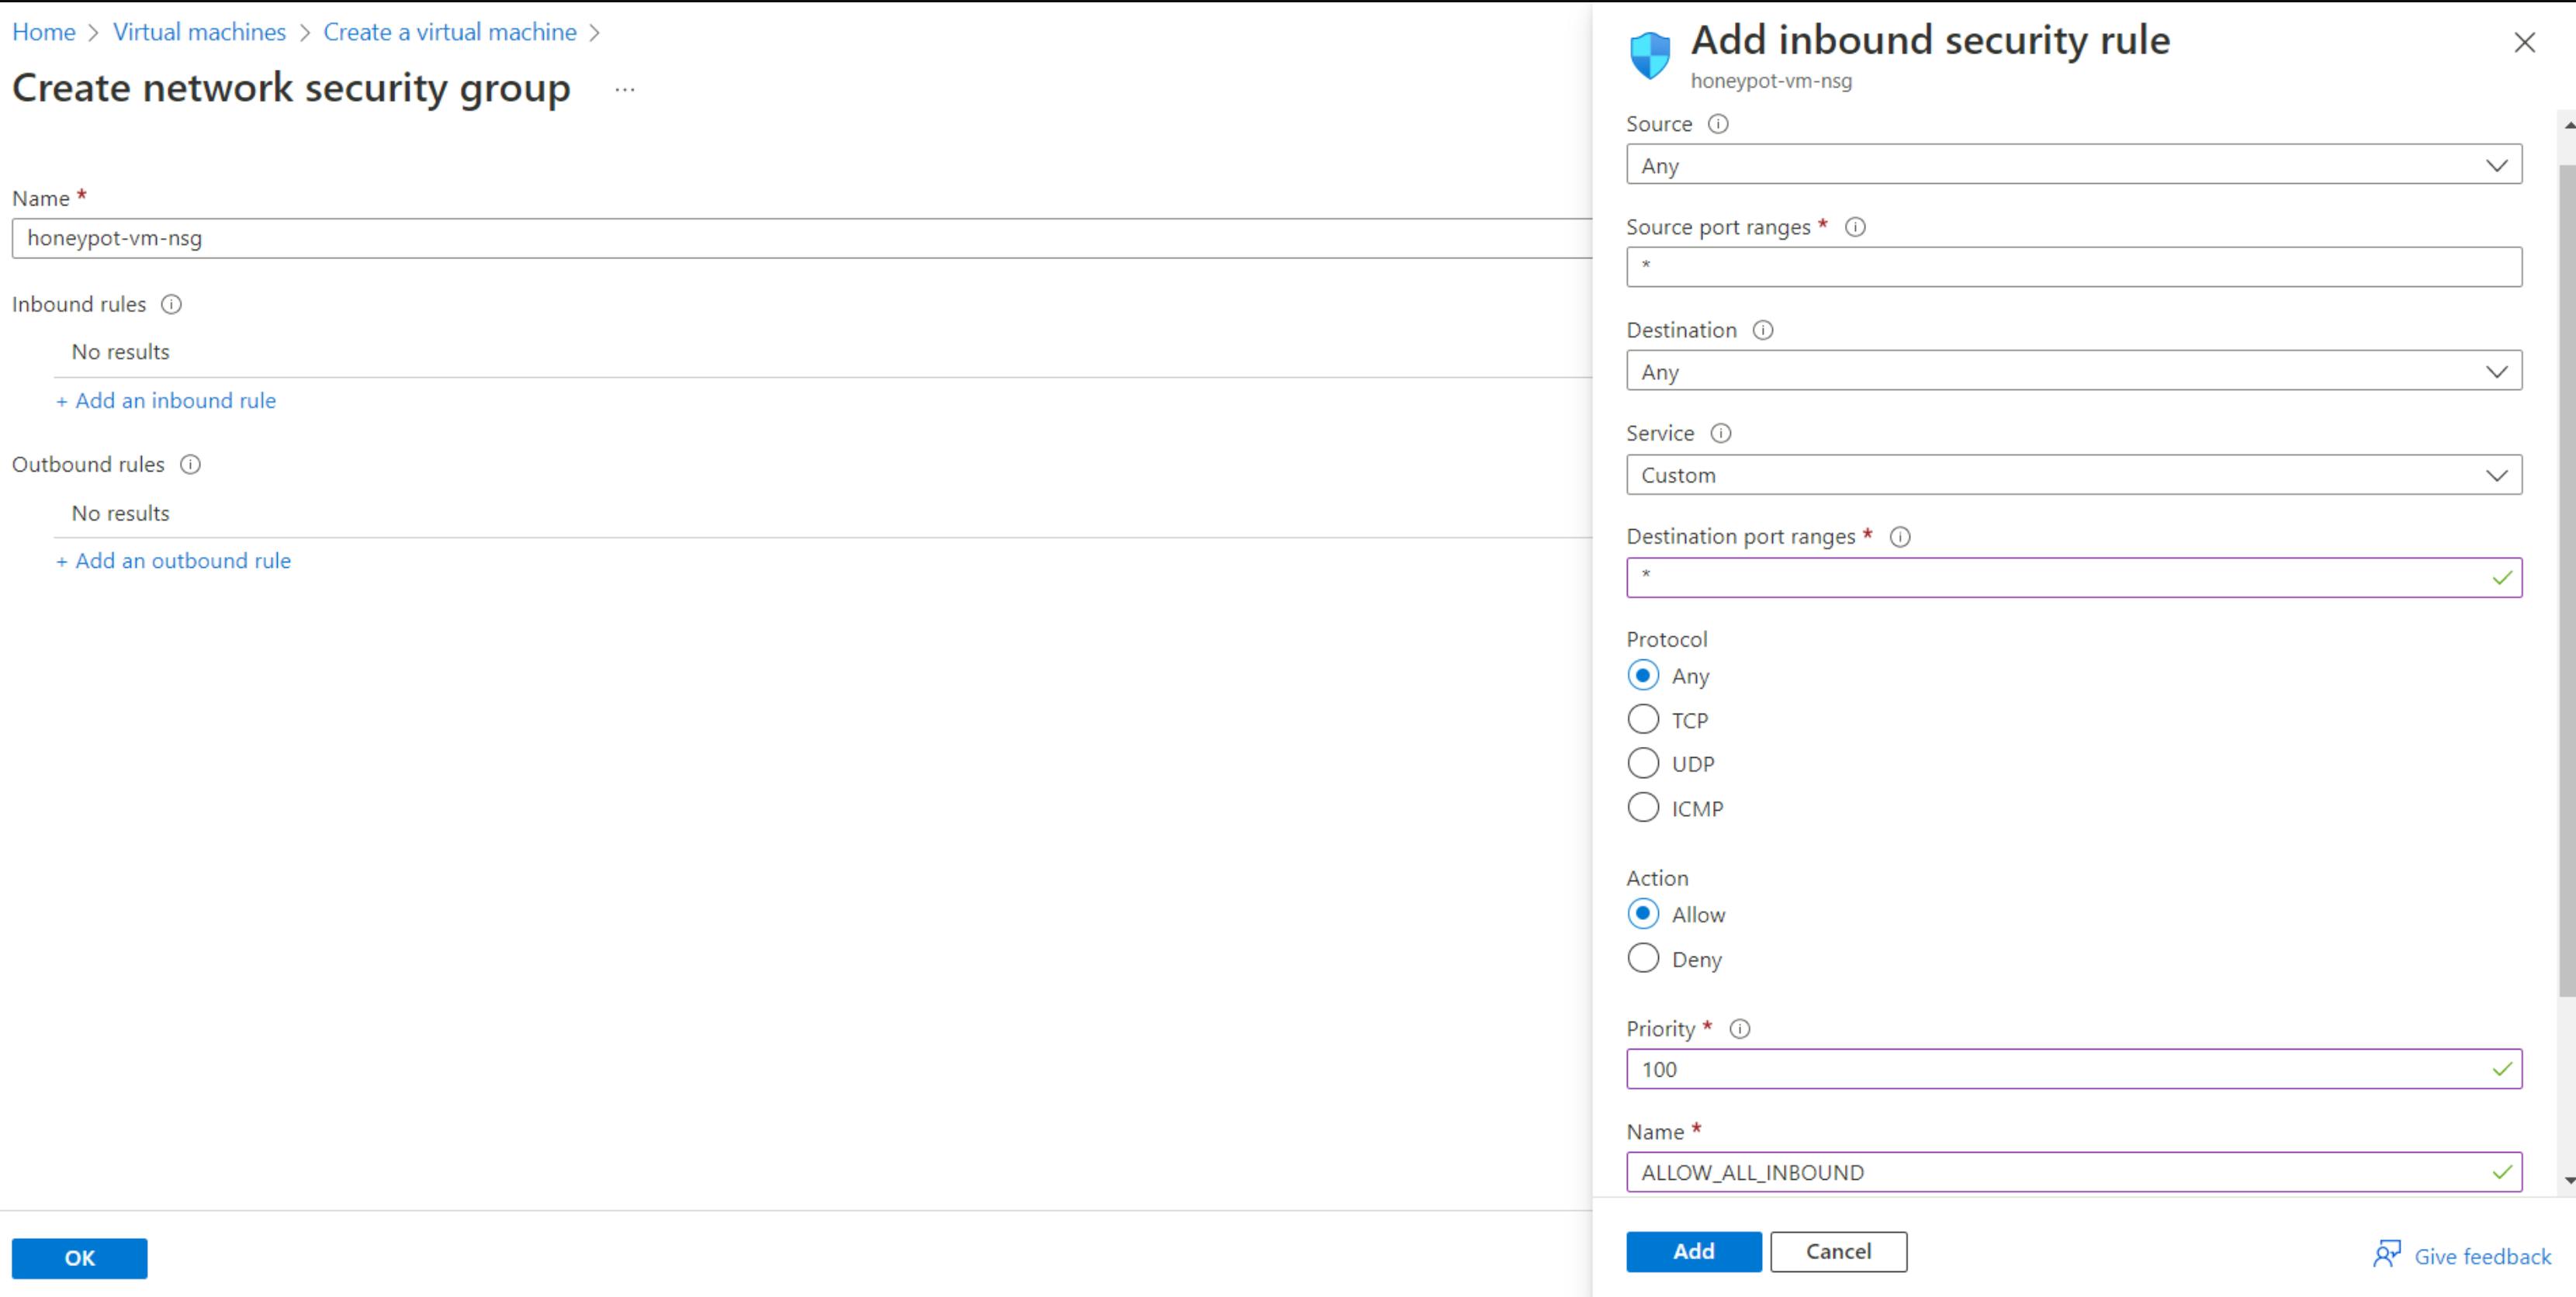
Click on the networking tab, under NIC Network Security Group click Advanced, then Create New
Delete the default inbound rule then click Add an Inbound Rule. Mirror the following settings:
Step 3: Create a Log Analytics Workspace (LAW)
The LAW will provide a location for us to send our logs from various sources, but in this case just our virtual machine. Once within the LAW, we can perform many actions on the data including storage, analyzation, and transformation.
Search for and click on "Log Analytics Workspaces", then click Create
Put it in the same resource group as VM (sentinel-lab)
Give it a desired name (honeypot-law)
Add to same region (West US 3)
Click Review + create
Step 4: Configure Microsoft Defender for Cloud
Search for "Microsoft Defender for Cloud"
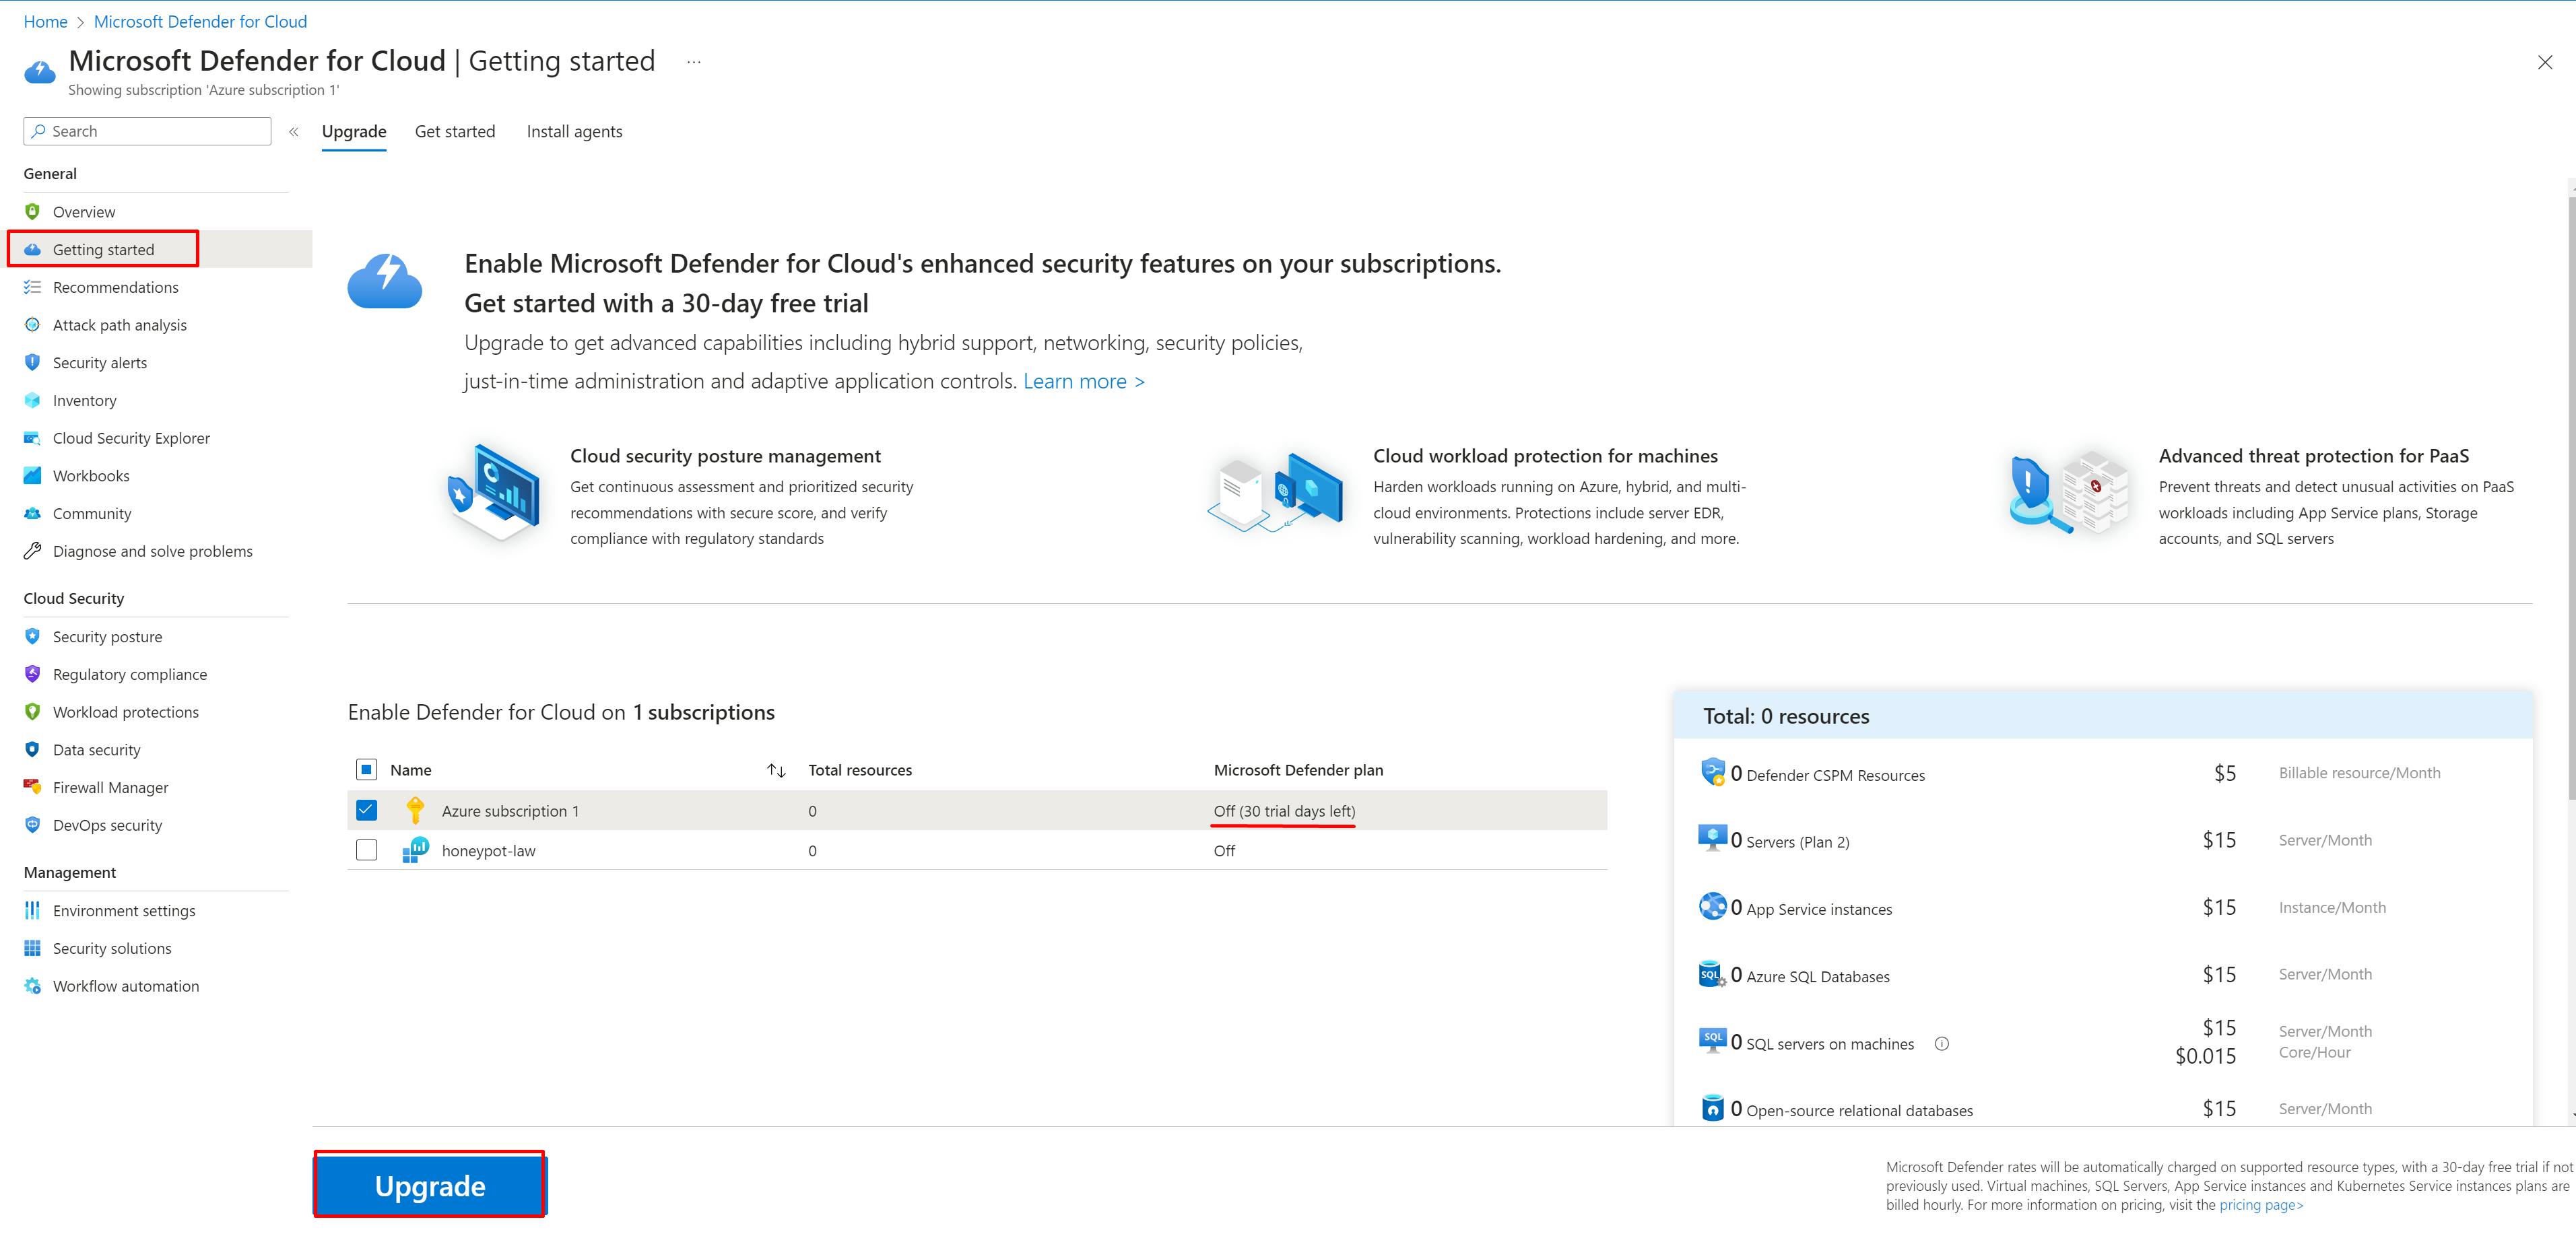
Look for "Getting Started" on the left side. The underlined section should say "On (30 trial days left)". Click Upgrade at the bottom which will begin the 30 day free trial.
Now scroll down to and click "Environment settings" in the left panel. Then look for your subscription name (Azure subscription 1, in my case) and expand the drop down arrow. Click your log analytics workspace name (honeypot-law for me).
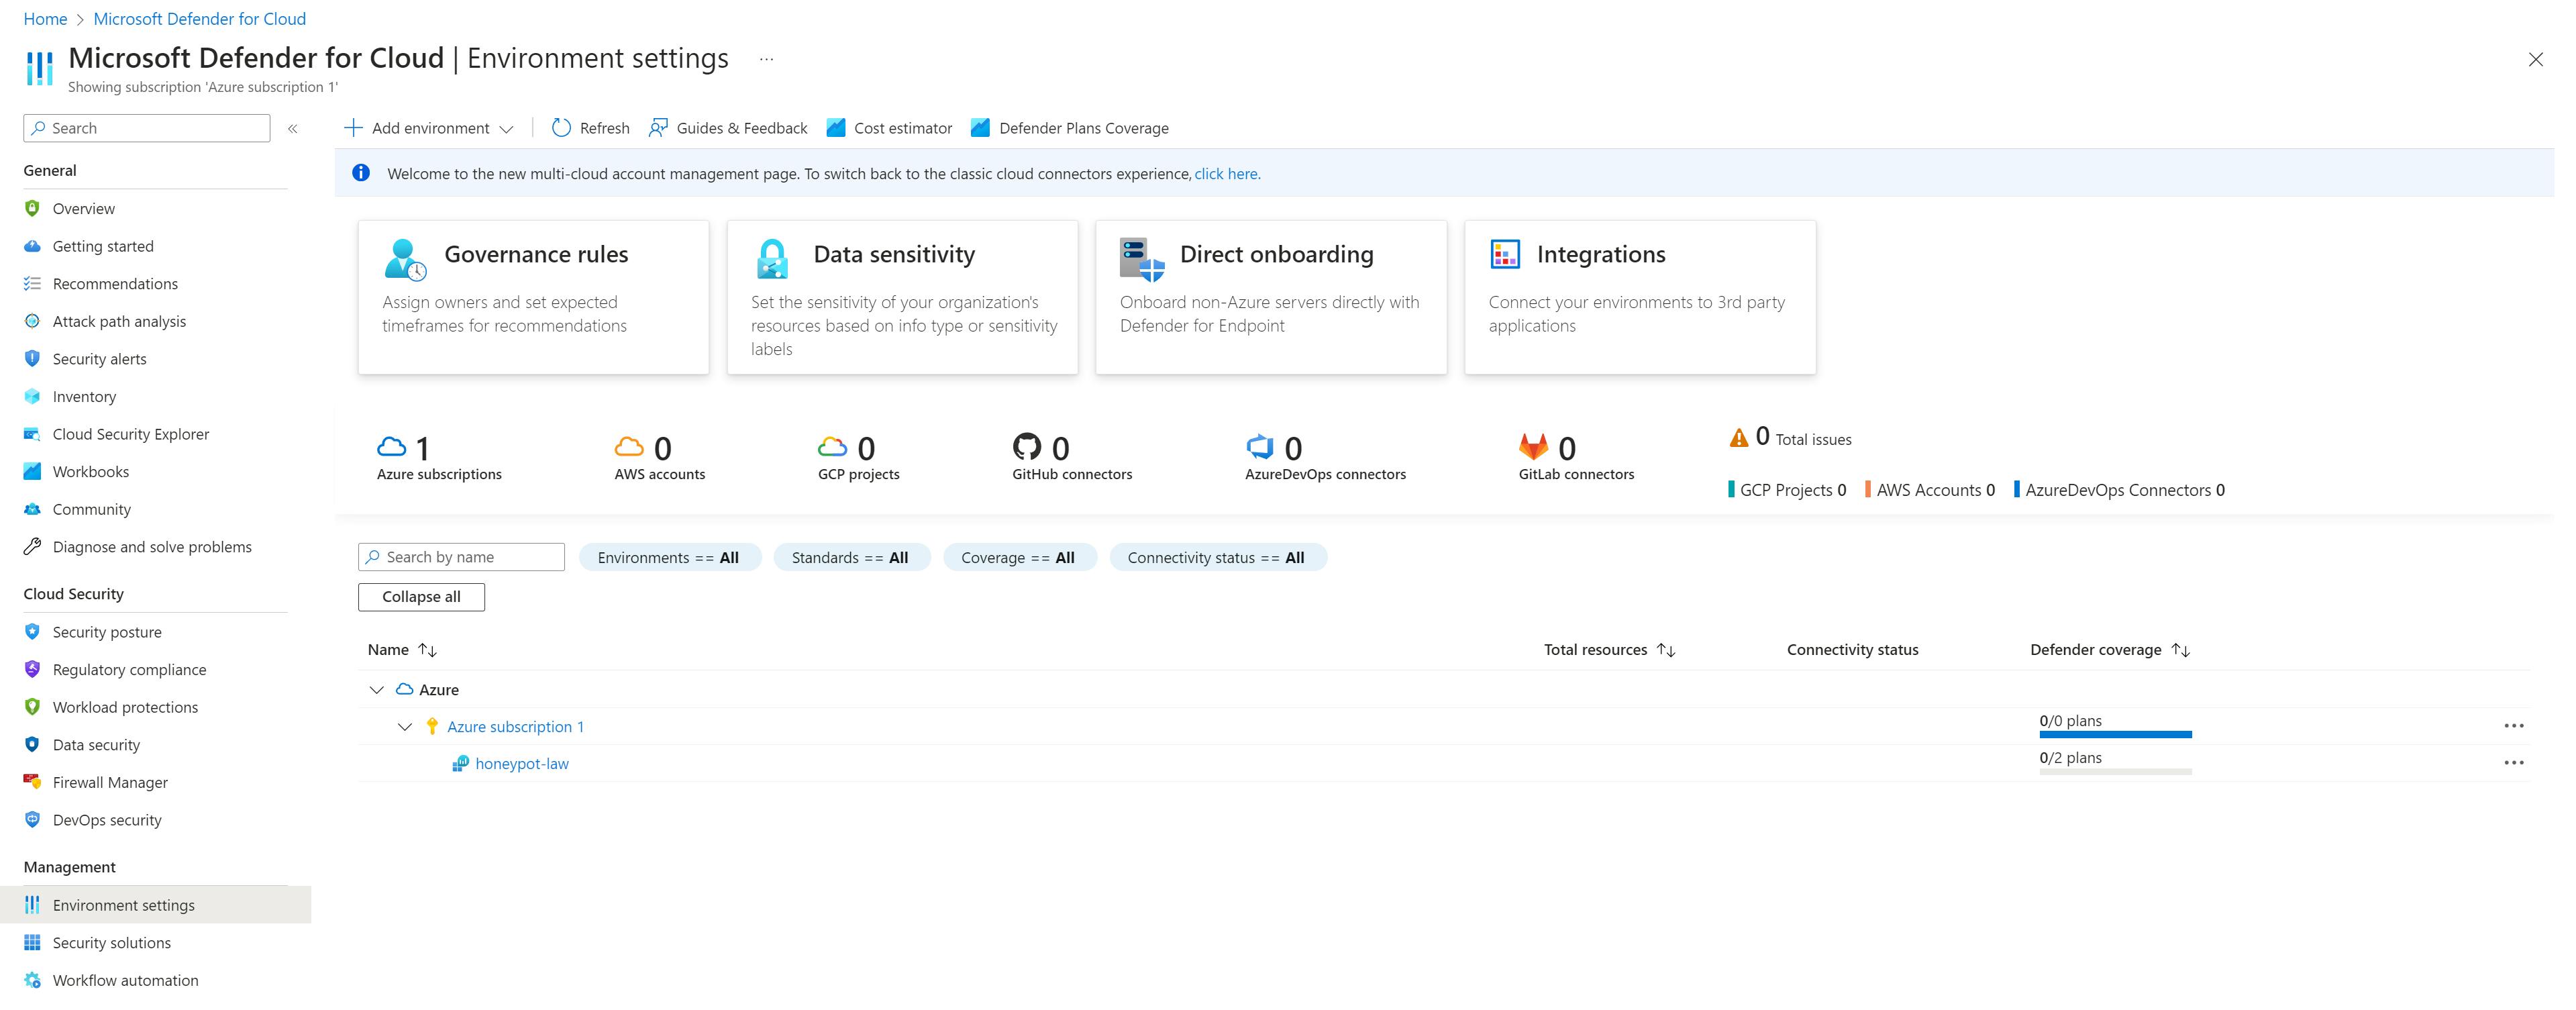
Toggle On both "Foundational CSPM" and "Servers" and click Save in the top left.
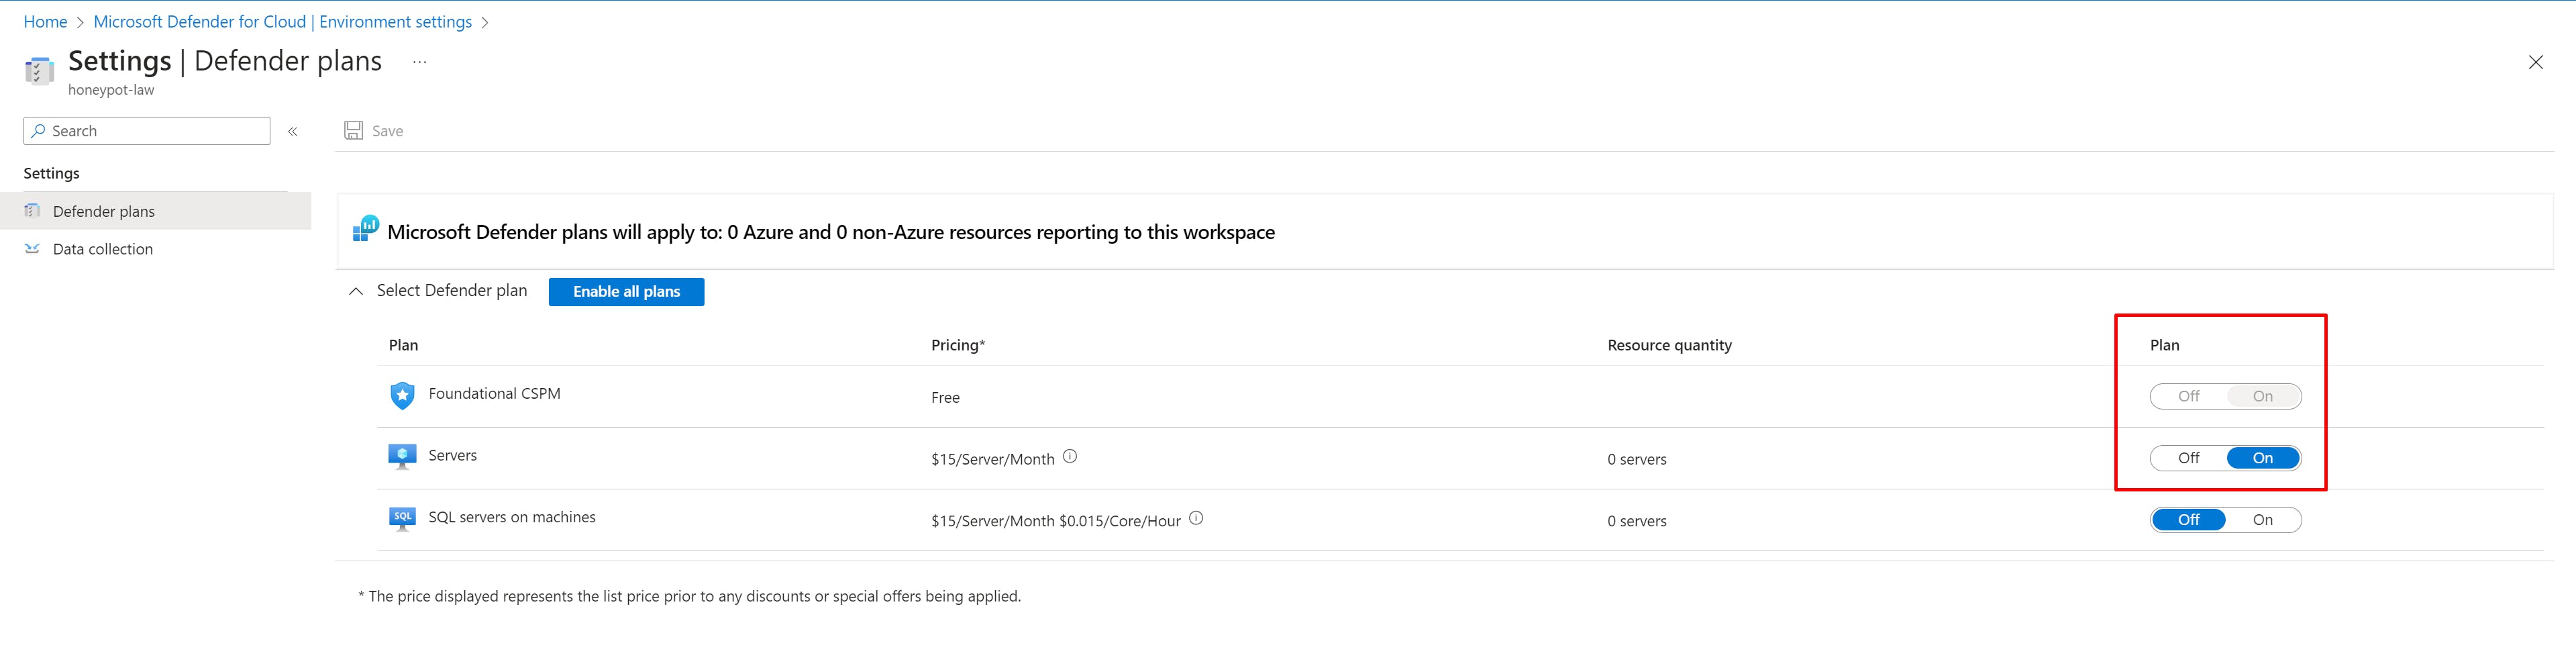
Click "Data Collection" on the left panel, then select "All Events" and click Save.

Step 5: Connect Log Analytics Workspace to the VM
Search for "Log Analytics workspaces"
Click your workspace name (honeypot-law) > "Virtual machines (deprecated)" > virtual machine name (honeypot-vm01)
Click Connect
Step 6: Setup Azure Sentinel
Search for and click on "Azure Sentinel"
Click Create, then link it to your previously created LAW (honeypot-law)
Step 7: Disabling the VM Firewall
Go back to Virtual Machines within the Azure Portal and select your created VM.
On the main page, look for "Public IP" on the right side and copy it to your clipboard.
Open Remote Desktop Connection on your personal computer and paste that IP Address, then click Connect.
You should see a popup like below. Enter the admin credentials you created during step 2 and click OK.
Upon connecting you'll be prompted with a number of selections regarding Windows telemetry. Toggle all options to "No" and click Accept.
Click start within Windows on the VM and search for "wf.msc" and open it.
Here, click Windows Defender Firewall Properties; then go to the Domain, Private, and Public profile tabs and turn each firewall state "Off."

Step 8: Setting up PowerShell Script
In your VM open PowerShell ISE.
Visit this link and copy all the code. Paste it into PowerShell ISE.
Visit https://app.ipgeolocation.io/ and sign up for a free account. Once logged in copy your API Key and paste it into the script, overwriting the previous API Key.

Save the script to the desktop (Log_Filter.ps1).
Run it from ISE by clicking the green play button or close ISE, right click the .ps1 file and click Run with PowerShell.
At this point I was going to attempt to connect to my VM with an incorrect username/password to ensure the script was working, but within seconds I was already receiving numerous attempts to login to the machine.

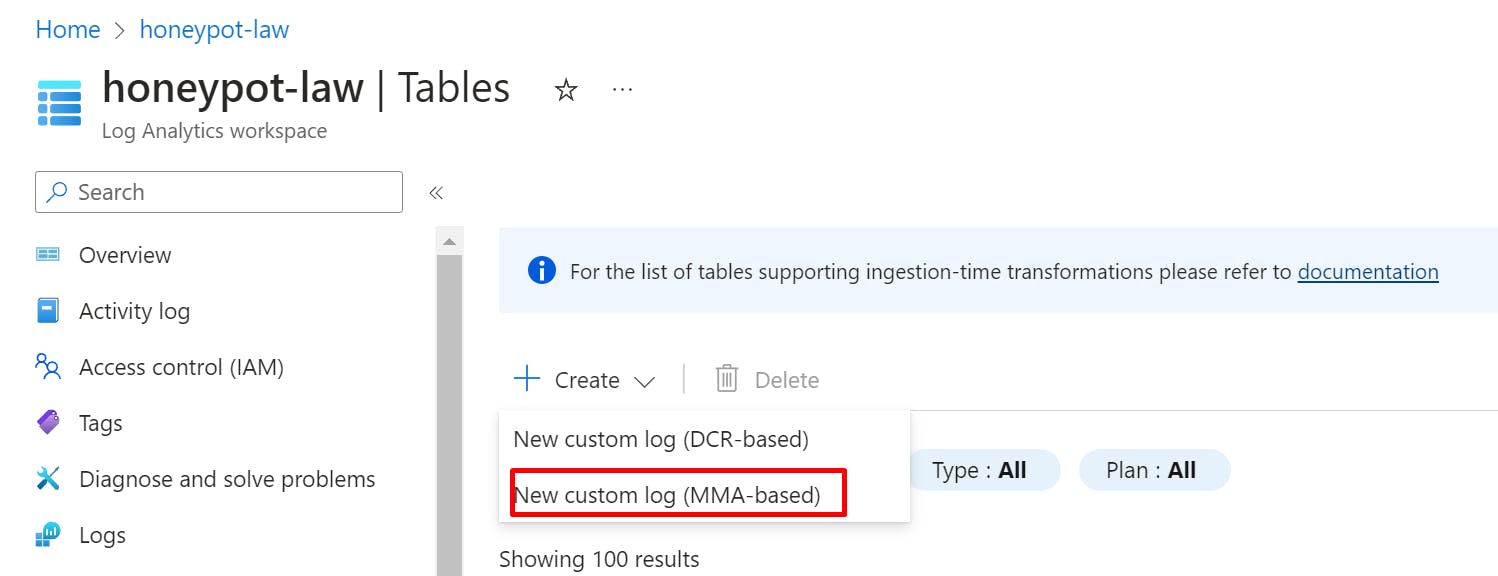
Step 9: Create Custom Log in Log Analytics Workspace
Within portal.azure.com, go back to Log Analytics Workspace and select your active LAW.
In the left panel, click on Tables > Create > New custom log (MMA based)
In your VM, navigate to C:\programdata\ and copy the failed_rdp.log file to your physical computer desktop.
Back in Azure, upload the .log file as the sample log it requests.
Click next until you're prompted for the collection path. Select Windows for type and put C:\ProgramData\failed_rdp.log as the path.
Click next until prompted to name the log, put FAILED_RDP_WITH_GEO
Step 10: Query the Custom Log
In Log Analytics Workspaces go back to your workspace (honeypot-law) > Logs
Type "FAILED_RDP_WITH_GEO_CL in the query window and hit Run
 💡If nothing shows up here yet, just wait. It can take up to an hour for the logs to appear in the query.
Step 11: Create a Workbook in Sentinel
Previously, you could extract custom fields from your custom logs, but this feature seems to be have been removed. To work around this, I built-in the custom fields into my Sentinel Workbook query as you'll see below.
Go to Microsoft Sentinel and click the law you created earlier (honeypot-law).
Click on Workbooks and Add workbook then click Edit.
Remove the two default widgets by looking for the three dots on the right side of the screen, clicking them, and then click Remove.
Click Add > Add query.
Copy/paste the following query into the query window and click Run.
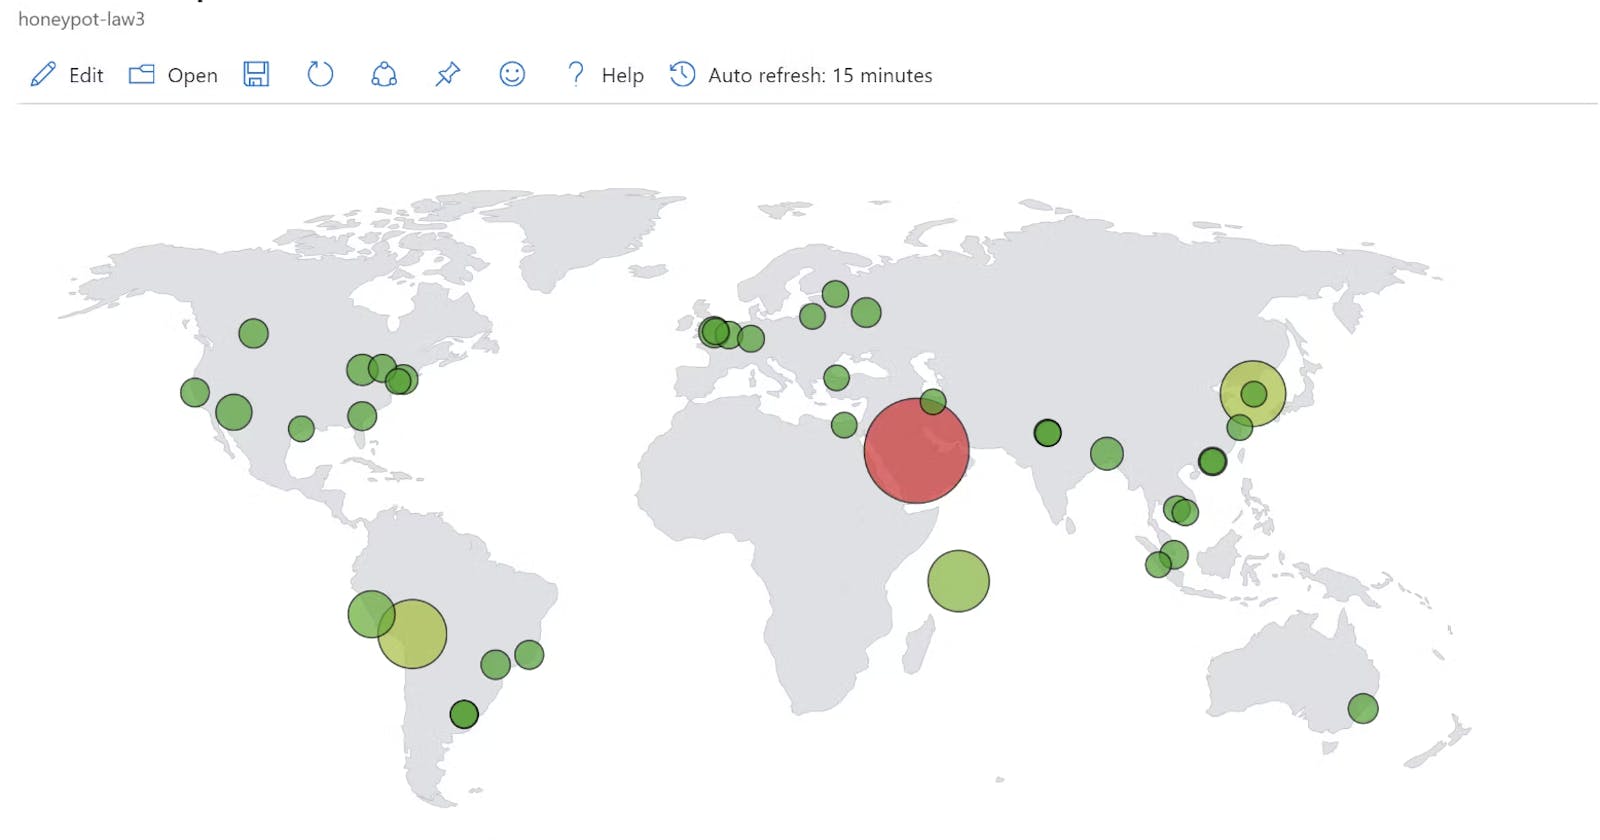
FAILED_RDP_WITH_GEO_CL | extend username = extract(@"username:([^,]+)", 1, RawData), timestamp = extract(@"timestamp:([^,]+)", 1, RawData), latitude = extract(@"latitude:([^,]+)", 1, RawData), longitude = extract(@"longitude:([^,]+)", 1, RawData), sourcehost = extract(@"sourcehost:([^,]+)", 1, RawData), label = extract(@"label:([^,]+)", 1, RawData), destination = extract(@"destinationhost:([^,]+)", 1, RawData), location = strcat(extract(@"state:([^,]+)", 1, RawData), ", ", extract(@"country:([^,]+)", 1, RawData)) | where destination != "samplehost" | where sourcehost != "" | summarize event_count=count() by latitude, longitude, sourcehost, label, destination, location💡Note: You can use this same KQL query in step 10 to get a view of the data with all the custom columns extracted.Afterwards, click the Visualization dropdown and select Map.
Select Map Settings and mirror the following settings:

You should see the map populated with the heat map data at this point.

Keep the PowerShell script running on the VM as long as you wish to keep collecting data. You can toggle Auto Refresh on the Sentinel Workbook to see changes as more connection attempts are logged.
Step 12: Deprovision Resources
Search for "Resource groups" > name of resource group (sentinel-lab) > Delete resource group
Type the name of the resource group ("sentinel-lab") to confirm deletion
Check the Apply force delete for selected Virtual machines and Virtual machine scale sets box
Select Delete
Afterthoughts
Overall, I enjoyed this lab as a first foray into working with a SIEM and especially within Azure. I would like to expand on this in the future and I have some ideas I'm going to list below. Additionally, there were some issues I ran into along the way which I'll briefly go over now:
I initially used the standard_B1s VM size since it is free tier eligible. But, after struggling to get it to function at all for literally hours I gave in and created a new VM with the standard_B2s size. Since my account had $200 credit I knew I'd be fine for the short time span of this lab.
The instructions for the lab are a bit old and some features required were no longer available. One such feature was the ability to extract fields within the logs in LAW. To get around this, I had to build in the field extractions into the sentinel workbook query.
- While I was at it, I modified the KQL workbook query to display combined state & country info on the map without using latitude/longitude since they are not as user friendly to read.
Another issue was that it seems the IP Geolocation API seems to have implemented a max 1,000 requests per day limit on free accounts. To get around this, I created several free accounts and just cycled the API keys in my code manually.
I noticed that when I hit the 1k requests limit the PS code would keep running. I assumed this would mean the API response would be empty and thus those lines in the log would be missing that data, but instead it started applying the last successful response's information for country, state, etc. to any future requests resulting in incorrectly labelled data. To resolve this I built-in some error handling for the code so that if the API request returned a 429 status code it would end the script. At that point I'd switch in the next API key.
I also had to go back in the log and I isolate the incorrect data by looking at what time I received the email about my request limit being reached and when I turned off the script. I then deleted the incorrect data and rebuilt my LAW so it will pull in the fixed log file fresh.
Additions
Add SSH & Telnet logs and map those out as well.
- I briefly tried this out by installing OpenSSH server on the machine and kept an eye on it over the course of about a day. I received some attempts to connect, but not nearly as many as RDP. Perhaps if I kept it online longer it would've picked up, but it also would make sense to me that there are more bad actors out there looking for easy RDP vulnerable PCs than SSH.
Spin up a VM in another geographical location and compare where the attacks for that VM come from versus my initial VM in West US 3.
- I actually tried this one and had an interesting find. I created a new VM in East US, disabled the firewall and waited around 24 hours. During this time I received literally zero connection attempts via RDP (other than my own). I'm not sure if this was a fluke, if I misconfigured something when spinning up the new VM, or attackers just hate machines in East US! I'd like to give this a shot again in the future to confirm if this was a fluke or not.